Introduction
Dose volume histogram was first introduced in 1979 by Goitien and Verhey. Dose Volume Histogram (DVH) are presented as structure based DVH and non- structure based DVH. Non structure based DVH are less occasionally used and predominantly structure based DVH is used, though it has gross uncertainties in the precise location of structure. DVH are the result of statistical analysis of the discrete dose sampling points with respect to volume ( dose sampling points either be a 3D grid or randomly distributed dose sampling points).
The volume of interest is either Target, Organ At Risk (OAR), or in case of brachytherapy , it is the volume defined with relation to the implant itself.
The horizontal axis is of dose expressed (independent variable) in absolute value i.e. cGy or Gy, or-else in relative value [%] and the vertical axis is volume (dependent variable) is expressed in absolute value i.e. cc or in relative vaule [%]
Types of DVH
- Differential DVH (dDVH)
- Cumulative DVH (cDVH)
- Natural DVH (used in brachytherapy) (nDVH)
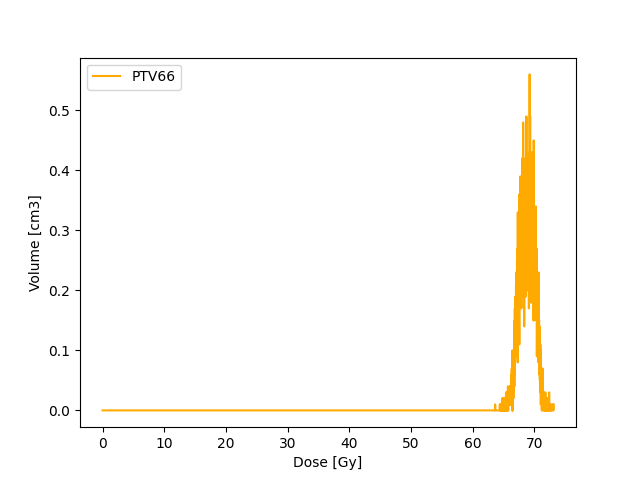
Differential DVH
It is the frequency distribution within the Volume Of Interest (VOI). The dose value are separated into specific number of bins. The bin size can be arbitrary. Then the exact number of sampling points within the each bins are calculated. Then it is multiplied with the 3D grid size if grids are used or in case of sampling points , assumed volume of each sampling is considered. Thus specific volume within each bin is obtained and plotted either as a bar graph or continuous graph.
The narrower the peak of the dDVH the more homogenous the dose distributions are within the volume of interest.
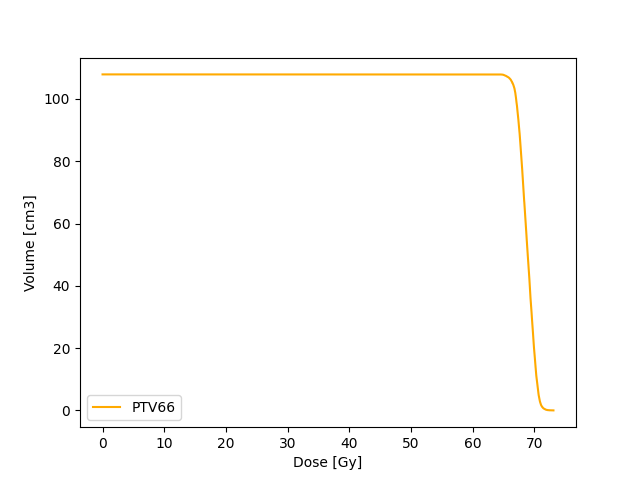
Cumulative DVH
Unlike dDVH, the cDVH represents the volume of structure receiving certain dose or higher as a function of dose. The dose and volume can either be absolute values or relative values.
The cDVH can be extracted from dDVH using

Target coverage (e.g 95 % dose is received by 100 % volume) as well as dose constraints to organ at risk (e.g. V20 30%) can be assessed with cDVH.
Natural DVH
Natural DVH is used to assess the brachytherapy plans. Below illustration of differential DVH shows the effect of inverse square law in it

The radioactive sources are placed inside the tumour or over it in case of brachytherapy. As a result the tumour is in a high dose region. The solid line in above illustration depicts the dDVH of the whole calculated structure. The vertical dotted line separated the high dose and low dose region in calculated volume. We are most interested about the information’s regarding the dose distribution such as dose homogeneity within the tumour but what we see is just a flat line in tail end of dDVH. This is due to the inverse square law effect in the dDVH (i.e. while normalizing the volume, the low dose region has more volume than high dose region, thus this suppresses the dvh in the high dose region).
To remove this effect Anderson came up with a idea on nDVH, where instead of volume, he used volume divided by dose raised to (-3/2) is used against dose.
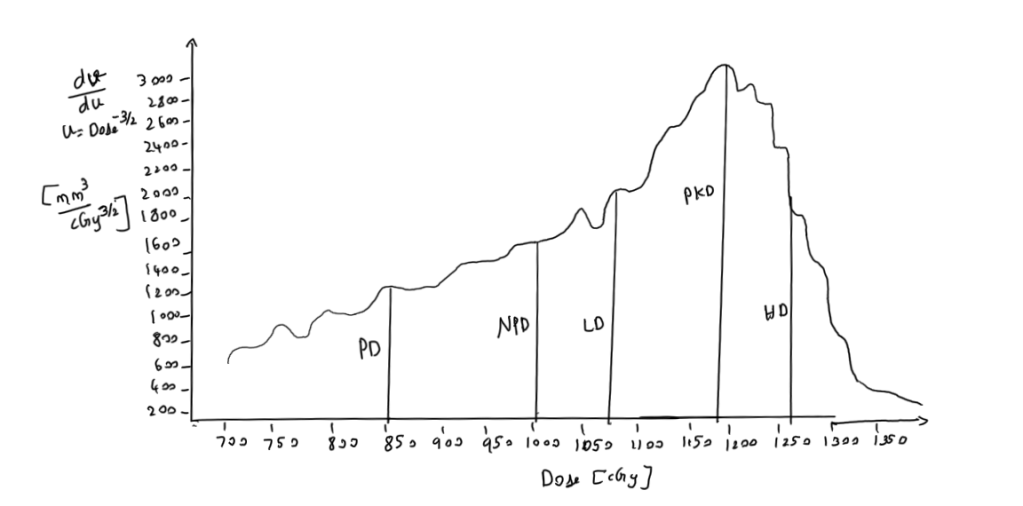
- LD = Low Dose Side
- HD = High Dose Side
- LD and HD are dose at half maximum of the peak dose on lower side and higher dose side
- PD = Prescription Dose
- PkD = Peak Dose
- NPD = Natural Prescription Dose
- NPD is determined by steep dose decrease due to inverse square law in low dose region(i.e.) It is the dose at which low dose region stops and high dose region starts. This can be found by drawing tangents over the DVH curve
- Natural Dose Ratio(NDR) = NPD/PD
Possible inferences that can be made from nDVH
- Ideally PD should coincide with the LD
- PD < LD produces a relatively low uniformity index
- PD > LD indicates a large volume with a low dose gradient, receiving lower doses than the reference dose
- Ideal NDR = 1 ; NDR > 1 overdose ; NDR < 1 under dose.
Uniformity Index is defines as

- V(PD-HD) = the volume receiving a dose between PD and HD
- V(PD) the volume receiving at least the prescription dose PD
- u(D) =D^(-3/2)
The above expression depends on the reference dose. Manipulation of reference dose will affect the uniformity index. To overcome this influence, one more quality index was introduced by eliminating the dependence of reference dose.

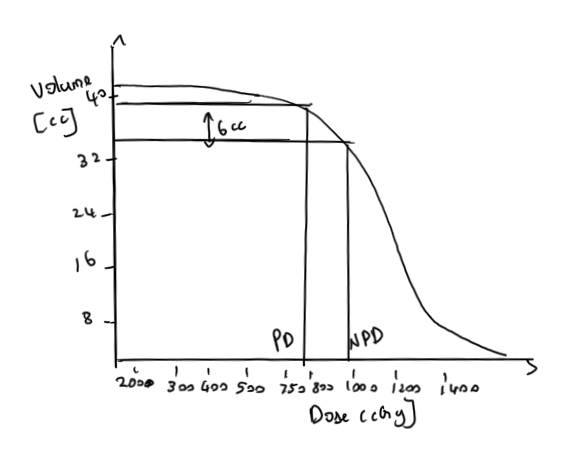
The nDVH provides assessment of uniformity and overdosage but do not provide information about target coverage. The possible way to find the target coverage is by plugging in the NPD value from nDVH into cDVH.
We have seen 3 types of DVH. DVHs have been proven to be useful tools in helping planners evaluate and compare treatment plans.
References
- Bice Jr, William S. “Post Implant Evaluation.”
- Moerland, Marinus A., et al. “The combined use of the natural and the cumulative dose–volume histograms in planning and evaluation of permanent prostatic seed implants.” Radiotherapy and Oncology 57.3 (2000): 279-284.
- Anderson, Lowell L. “A “natural” volume–dose histogram for brachytherapy.” Medical physics 13.6 (1986): 898-903.


